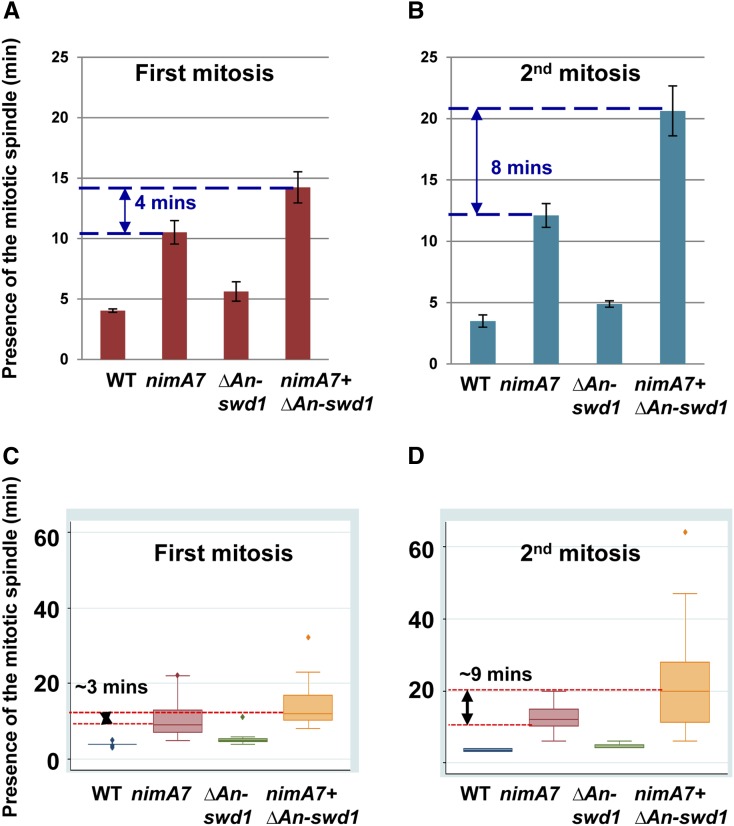
Figure 6.
The absence of Set1 complex function in combination with partial NIMA function results in enhanced mitotic delays. (A) The time spent in the first mitosis by each of the mutant strains is indicated compared to the WT strain. WT, n = 13; nimA7, n = 21; ΔAn-swd1, n = 8; and nimT23 + ΔAn-swd1, n = 21. (B) The time spent in the second mitosis by each of the mutant strains is indicated compared to the WT strain. WT, n = 2; nimA7, n = 14; ΔAn-swd1, n = 9; and nimT23 + ΔAn-swd1, n = 37. (C and D) Variability in the time spent in mitosis within the cell population in each of the indicated strains is represented by a box and whiskers plot for the first mitosis (C) and subsequent mitosis (D). Spindle formation was used as a measure of determining time in mitosis. Strains used to compute the average time in mitosis: WT = MG224; nimA7 = MG190, MG227, and MG229; ΔAn-swd1 = MG244; and nimA7 + ΔAn-swd1 = MG213 and MG243. The data for WT and nimA7 cells in A and C were previously reported in Govindaraghavan et al. (2014a).

