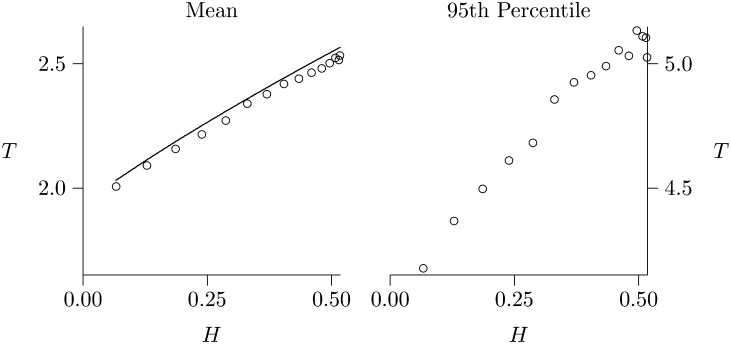
Figure 1.
The depth, T, of gene genealogy given heterozygosity, H. The left and right panels show the mean and the 95th percentile in units of 2N generations. Solid line shows expected values, based on the model of Griffiths and Tavaré (1998, equation 1.5, p. 276). Open circles show results from coalescent simulations. These results assume a sample of 30 diploid individuals and a mutation rate of 0.02 per 2N generations. The slope is greater in the right panel than in the left, indicating that heterozygosity has a stronger effect on the upper tail of the distribution than on the mean.

