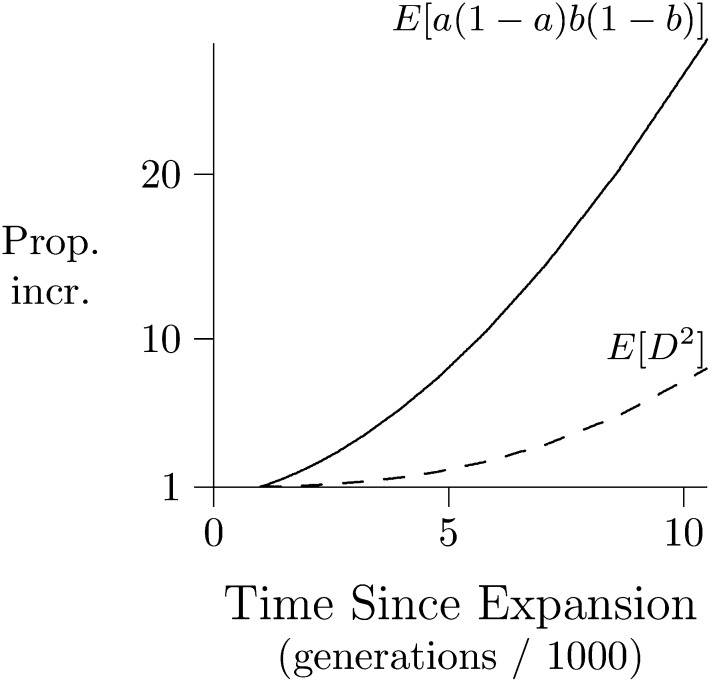
Figure 10.
The time path of the numerator and denominator of following a population expansion. Dashed line shows numerator of , relative to its value in generation 1000. Solid line shows the denominator in the same way. Loci are separated by 0.02 cM. Population history is as in Figure 9.

