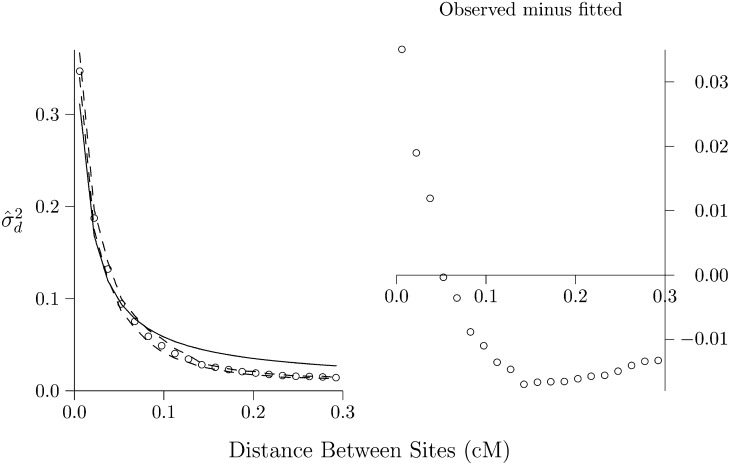
Figure 11.
LD curve for chromosome 1 in Europe. In the left panel, open circles show the estimated values of and dashed lines show a 95% bootstrap confidence region, generated by moving-blocks bootstrap. Solid line shows the equilibrium curve that minimizes squared errors between observed and expected values. In the right panel, differences between observed and fitted values are shown. All analyses are based on a sample of 120 chromosomes. Source: CEU data set from the 1000-Genomes project (1000 Genomes Project Consortium 2012). Genetic map data, downloaded from the 1000-Genomes website, were estimated from phased haplotypes in HapMap Release 22 (NCBI 36) (HapMap 2007).

