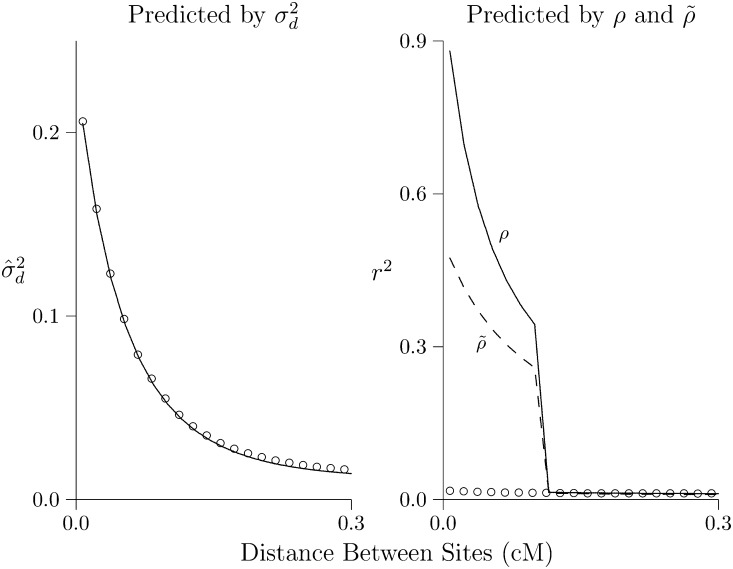
Figure 3.
Predicted and simulated LD. Each panel shows the same population 500 generations after expansion from 2N = 103 to 105. Lines show values predicted by [left panel (Hill 1975)] and by ρ (right panel, solid line) and (right panel, dashed line). Open circles show results estimated from simulations. Calculations assume that u = 1.48 × 10⁻⁸ per site per generation, and the haploid sample size is 100. Simulations involve 109 bp DNA.

