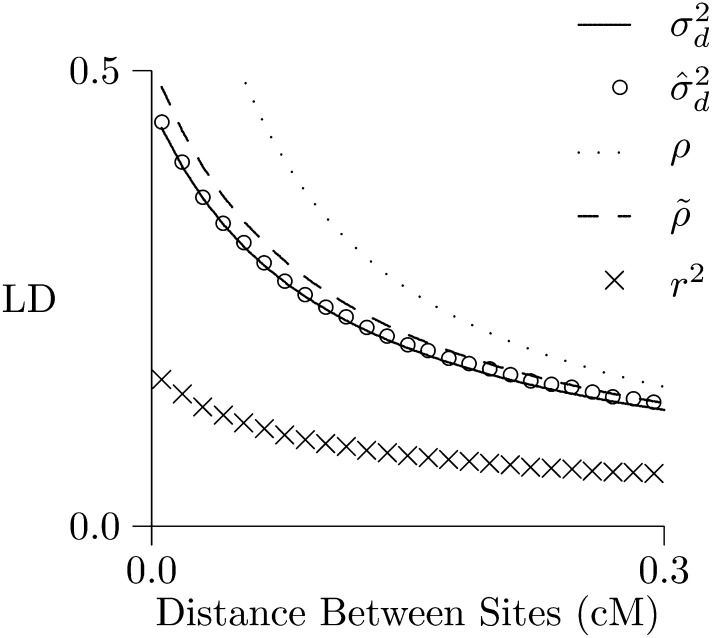
Figure 5.
LD curve under constant population size. Simulated values of r2 and were generated using MACS (Chen et al. 2009). was calculated using the method of Hill (1975), ρ was calculated from Equation 4, and from Equation 5. All calculations assume that 2N = 1000, u = 1.48 × 10⁻⁸, and c = 10−8 per nucleotide. Simulations involve 109 bp of DNA, which are sequenced in a sample of 100 homologous chromosomes.

