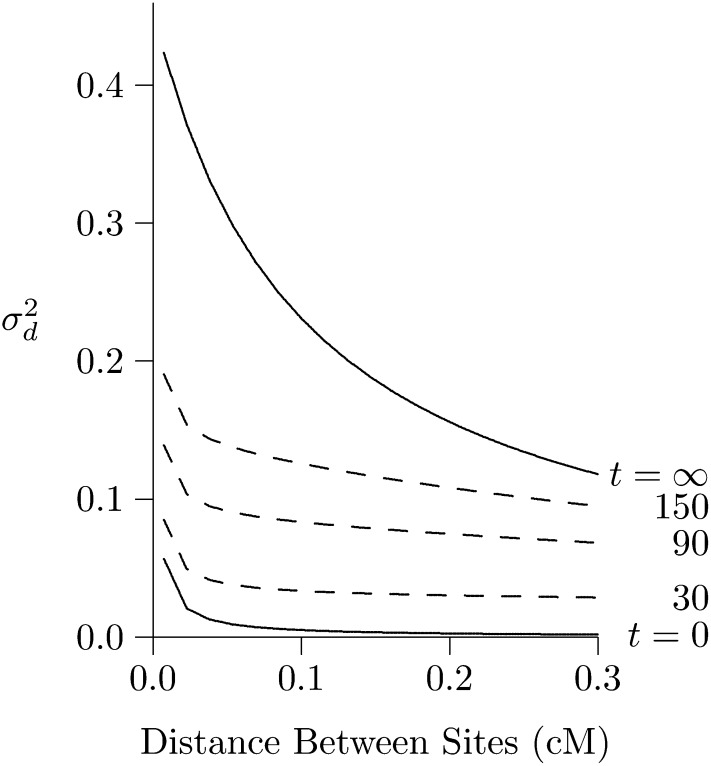
Figure 7.
Effect of population collapse on the LD curve. At time t = 0, this population collapsed in size from 2N = 105 to 103. Calculations use the method of Hill (1975), with u = 1.48 × 10⁻⁸. No correction for sampling bias was needed, as these calculations are not compared with simulations.

