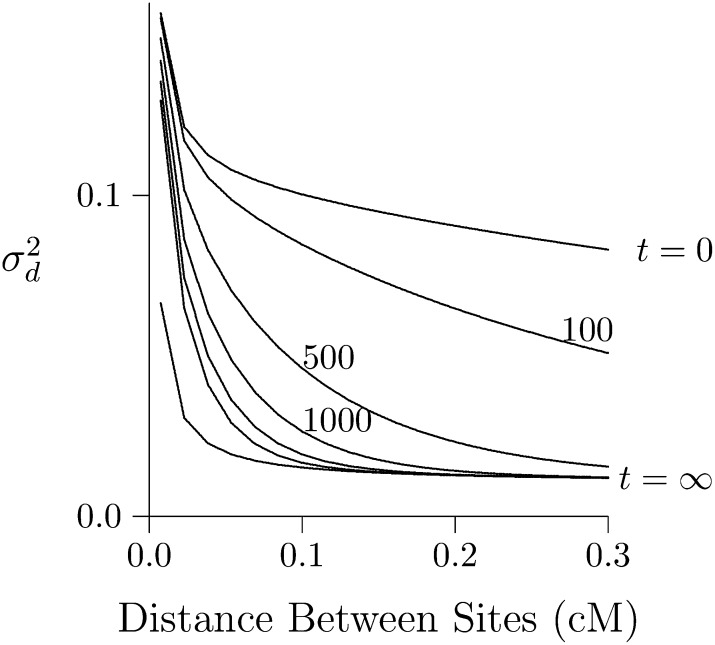
Figure 8.
Effect of a 100-generation bottleneck in population size. The curves show at various points after recovery from a 100-generation bottleneck, during which the population had size 2N = 103. Before and after the bottleneck, its size was 105. Other details are as in Figure 7.

