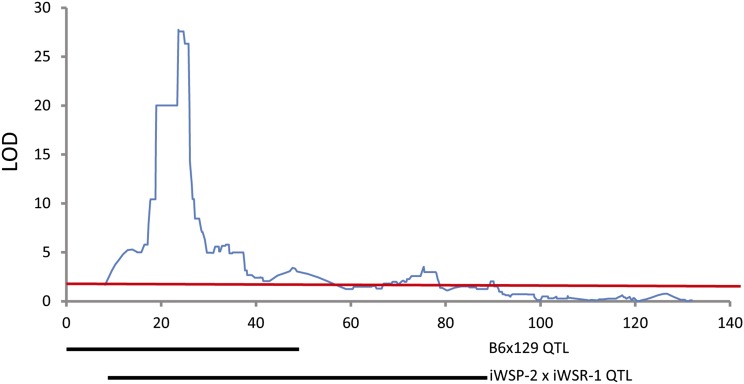
Figure 4.
A cis-eQTL for Ap3m2 expression in the hippocampus of the BXD RI population. The peak eQTL for Ap3m2 maps to chromosome 8 between 22.906 and 25.498 Mb (LOD = 27.74, P < 0.05). Chromosome 8 QTL map is plotted with megabase position (UCSC mm9, NCBI MGSCv37) on the horizontal and with LRS on the vertical [P < 0.05, LOD = 3.79 (red line)].

