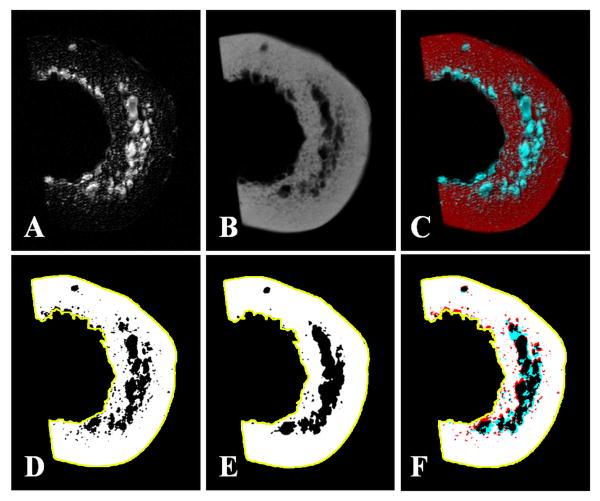
Figure 3.
2D FSE (A) and μCT imaging (B) of a bone sample and the corresponding registered image (C). Regions of interest representing the cortical shell (yellow line, DEF) were drawn, and thresholded. Porosity determined from FSE (D) and μCT (E) were similar, and showed good overlap on the difference image (F), where white, red, and blue areas indicate areas of overlap, μCT-only, and FSE-only, respectively.

