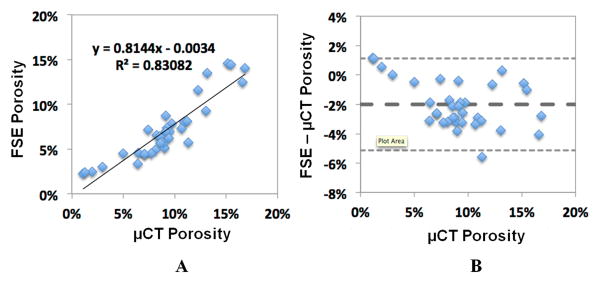
Figure 4.
Linear regression (A) and Bland-Altman analysis (B) were performed between cortical porosity assessed with FSE MRI and μCT imaging. A high correlation between FSE MRI and μCT porosity was observed (R2 = 0.83). Bland-Altman plot shows good agreement between FSE and μCT porosity, with a small bias of -2% for the FSE data and tight limit of agreement at around 3%.

