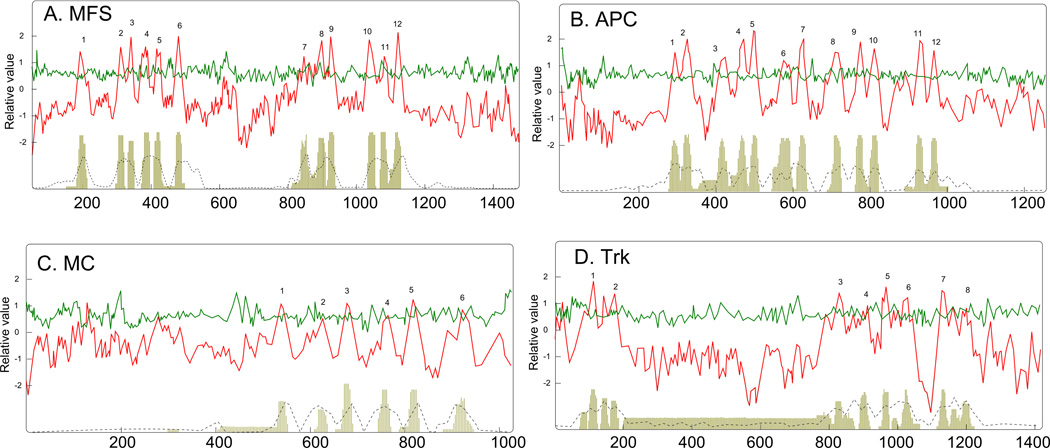
Figure 1.
Average hydropathy, amphipathicity and similarity plots using the AveHAS program for (A) the sugar porter family in the MFS, (B) The APC family in the APC superfamily, (C) the mitochondrial carrier (MC) family within the MC superfamily, (D) the Trk family in the VIC superfamily (see TCDB).

