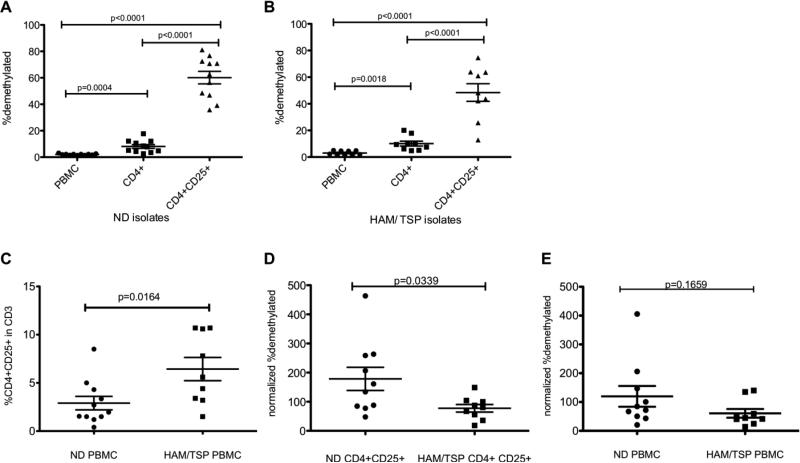
Fig. 1.
(A) % FoxP3 TSDR demethylation in ND PBMC (n=10), isolated CD4+ T cells, and isolated CD4+CD25+ T cells. (B) % FoxP3 TSDR demethylation in HAM/TSP PBMC (n=9), isolated CD4+ T cells, and isolated CD4+CD25+ T cells. The long horizontal bars represent the mean for each group while the shorter bars represent the standard deviation. (C) A comparison of the %CD4+CD25+ in CD3+ T cells of ND and HAM/TSP PBMC. (D) Normalized % FoxP3 TSDR demethylation in isolated CD4+CD25+ T cells of ND and HAM/TSP patients. % FoxP3 TSDR demethylation was normalized to the % CD4+CD25+. (E) Normalized % FoxP3 TSDR demethylation in PBMC of ND and HAM/TSP patients. % FoxP3 TSDR demethylation was normalized to the % CD4+CD25+.

