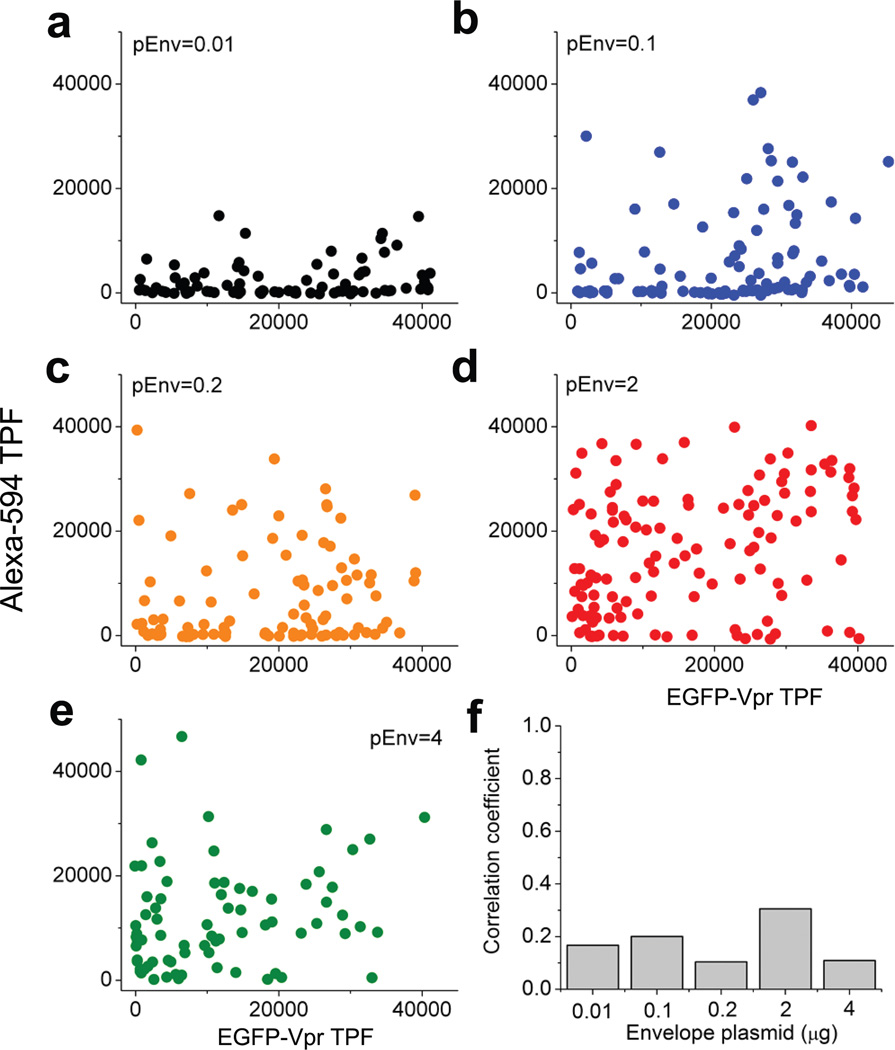
Figure 6.
Two-color correlation analysis for EGFP-Vpr and envelope glycoproteins in single HIV-1 virions. (a)–(e) Alexa-594 TPF was plotted as a function of EGFP-Vpr TPF for virions prepared with 0.01, 0.1, 0.2, 2 and 4 µg pEnv, respectively as indicated (the same color code as Figure 5c). (f) The correlation coefficients calculated for each panel from a to e as a function of the pEnv inputs during virion production.

