
Figure 2.
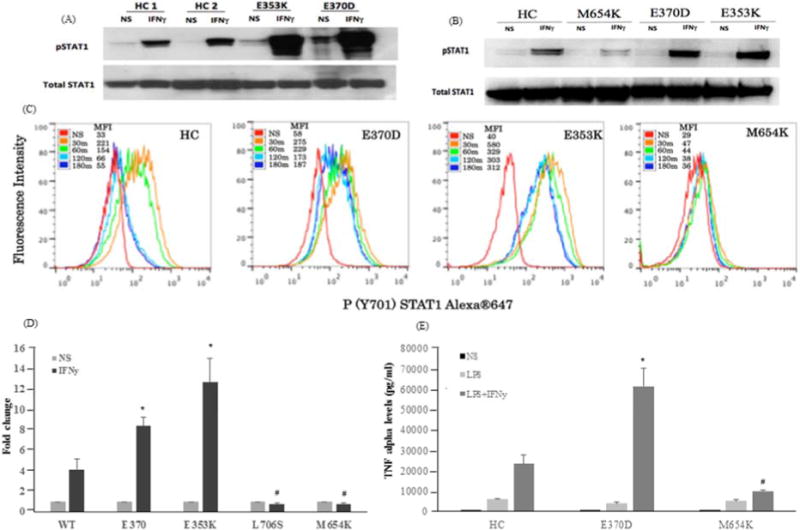
A, Immunoblotting (pSTAT1) of PBMCs and B, EBV-B cells from patients (E370-current patient, E353K -GOF control, M654K-LOF control) and healthy controls (HC) were stimulated or not (NS) with IFN-γ; C, pSTAT1 dephosphorylation (30–180 min) in EBV-B cells by flow cytometry. MFI, mean fluorescence intensity; D, Luciferase activity on U3A cells transfected with WT or mutant STAT1 (E370D, E353K, L706S and M654K-LOF controls). Data are mean (± SEM; n=3); E, Evaluation of TNF-α production (pg/ml) using bead cytokine assay from PBMCs of patients and HC (n=4) in response to LPS and IFN-γ. *, # p < 0.05 vs. WT.