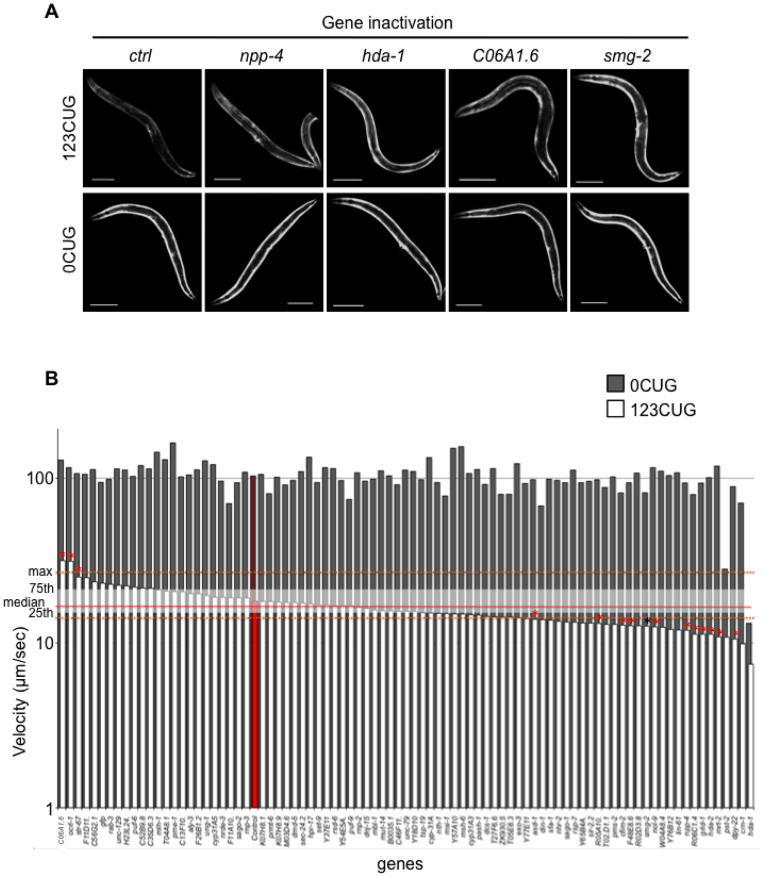
Figure 2.
Identification of gene inactivation that modulate expanded CUG repeat toxicity (A) Gene inactivations that disrupt the late stage down-regulation of GFP fluorescence mediated by 123 CUG repeats in the 3′ UTR. Fluorescent microscopy images of the strains 123CUG and the control 0CUG, on different RNAi gene inactivations: empty vector control (ctrl), npp-4, hda-1, C06A1.6 and smg-2. Images were taken at the 3d old adult stage. Bar, 200μm. (B) Genetic suppressors and enhancers of expanded CUG repeat toxicity. Graph of velocity measurements of 0CUG (grey) and 123CUG (white) animals fed on different gene inactivations. The plotted velocities (μm/sec) correspond to the median of at least two experiments, where the red bars correspond to strains fed on control vector. Red line indicates the median velocity, and white shading represents the 25th and 75th percentile for the 123CUG animals fed on control vector. The dotted orange line represents the maximum and minimum of the median velocity for 123CUG animals fed on control vector. Indicated by red asterisk (*) are the significant gene inactivations, where significance was determined by Kolmogorov-Smirnov p-value. The black asterisk indicates the gene smg-2.

