
Figure 3. Sex Differences in behavior and limbic activity by age group.
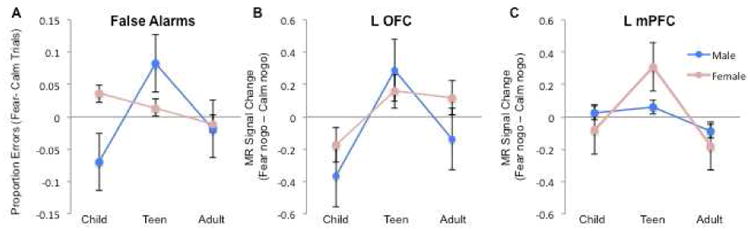
A) Difference score in number of false alarms to fear nogo trials relative to calm nogo trials by age group and sex; B) Beta weights for orbitofrontal cortex (OFC) to correct fear nogo trials relative to calm nogo trials by age group and sex; and C) Beta weights for mPFC to correct fear nogo trials relative to calm nogo trials by age group and sex.