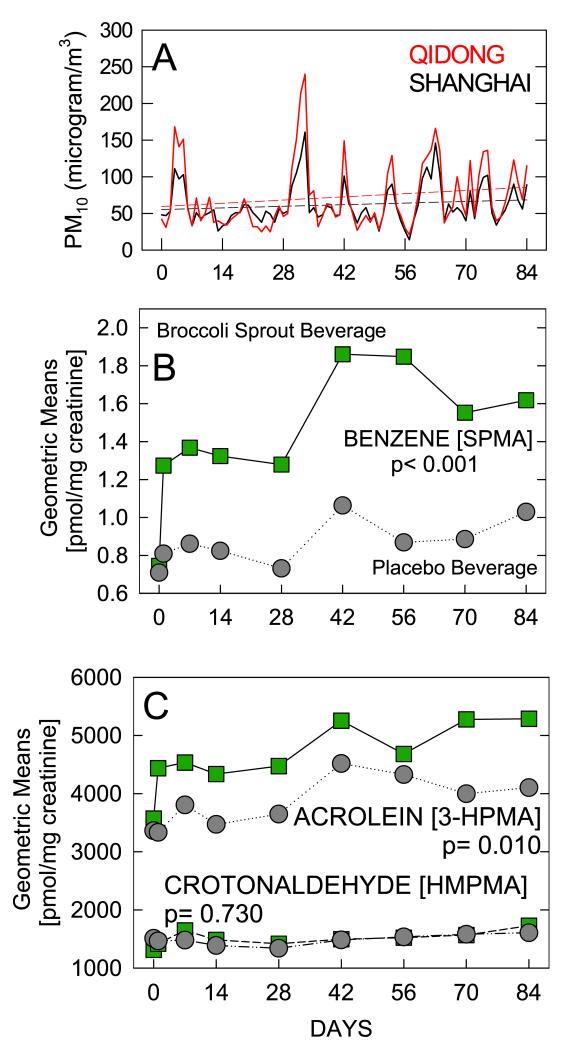
Figure 2.
Geometric means for biomarker levels on days 0, 1, 7, 14, 28, 42, 56, 70, and 84 of the intervention. A. Daily average levels for PM10 in Shanghai (black) and Qidong (red) during the study period. B. Urinary benzene mercapturic acid levels. C. Urinary acrolein and crotonaldehyde mercapturic acid levels. ( ) Broccoli sprout beverage arm; (•), placebo beverage arm. The geometric means for benzene appropriately accounted for left-censoring using the flexible PROC NLMIXED command in SAS 9.2.

