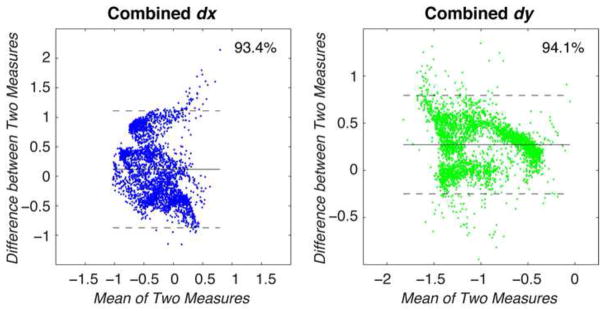
Figure 4. Bland-Altman analysis was performed to compare displacements measured in all discs.

Taking the values for all points of interest across all the discs, the mean and difference between x and y displacements were calculated and compared. Values for dx and dy showed that 93.4% and 94.1% of displacement values lay within the limits of agreement, with standard deviations of 0.52 and 0.27 mm, respectively.
