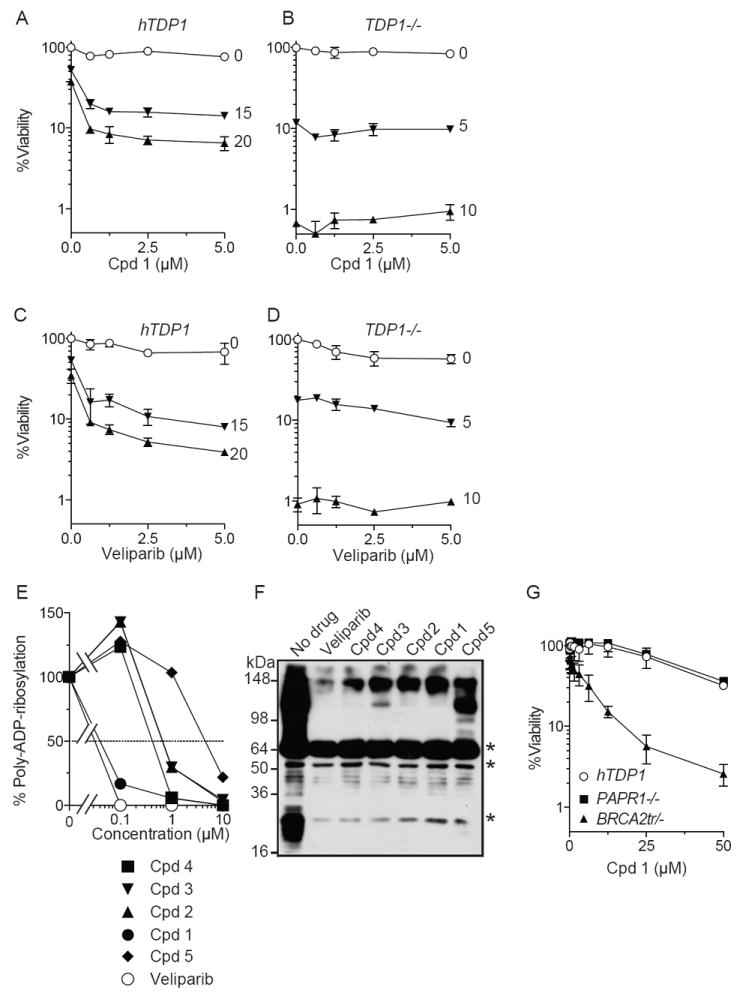
Figure 2.

Inhibition of PARP1 by compound 1 (Cpd1). A & B: Cellular viability in the presence of Cpd1 and various concentrations of CPT (indicated beside each curve in nanomolar unit) in hTDP1 (A) and TDP1-/- cells (B). C & D: Cellular viability curves in the presence of veliparib and various concentrations of CPT (indicated beside each curve in nanomolar unit) in hTDP1 (C) and TDP1-/- cells (D). E & F: Inhibition of PARP1 by compounds 1-5 in comparison to the PARP inhibitor veliparib measured by ELISA (E) and by Western blotting (F). Asterisks in (F) indicate non-specific bands. G: Cpd1-dependent viability curves in PARP1-/-, BRCA2tr/- and hTDP1 cells.
