Fig. 3.
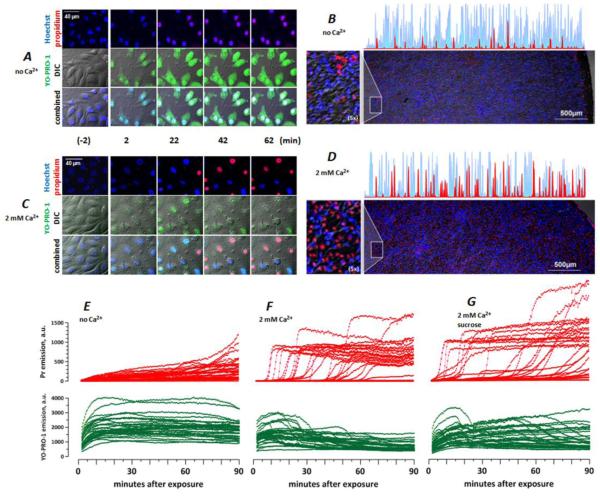
Ambient Ca2+ determines the membrane permeability in nsPEF-treated BPAE cells. Cells were exposed to nsPEF on ITO coverslips as described in text. Both the pulsing and the incubation buffers contained no added Ca2+ (A, B, E) or 2 mM Ca2+ (C, D, F, G); in G, the incubation buffer also contained 87 mOsm/kg of sucrose. A and C: DIC and fluorescence images at selected timepoints before (-2 min) and after nsPEF exposure. In all images, Hoechst emission is shown blue; Yo-PRO-1 is green, and Pr is red. B and D: representative low-magnification images at 90 min post nsPEF (20 pulses, 300 ns duration, 20 Hz, 600 V, on ITO coverslip in a 1-mm electroporation cuvette). Note random distribution of live (blue) and dead (red) cells over the coverslip surface and higher cell death with 2 mM Ca2+ (D). Also shown are selected line scans from the edge of the coverslip to its center (blue: Hoechst; red: Pr) and areas with additional 5x magnification (left). E-G: The time dynamics of Pr (top) and Yo-PRO-1 (bottom) emission in nanoporated cells. Each line in the graphs is the emission of a single, randomly chosen cell, as measured every 30 s. For clarity, the number of cells was limited to 30 per graph. Note different patterns of Pr entry without Ca2+ (E) and with 2 mM Ca2+ (F, G), and the lack of protection by sucrose (G).

