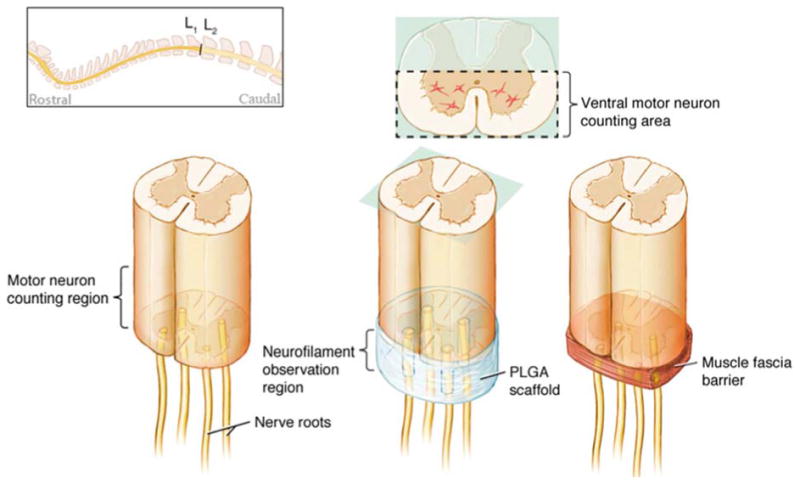
Figure 1.

Top left schematic shows the lumbar region (L1-L2) where the injury site was located. Left diagram depicts the experimental group consisting of nerve roots directly implanted onto cut spinal cord. Central diagram shows the PLGA scaffold experimental group with a single nerve root inserted into each of the four channels. The right diagram shows the control group with a muscle fascia inserted between the cord and the four implanted nerve roots. The motor neuron counting region for each group was immediately rostral to the injury as seen in left diagram. Axon regeneraton was observed in the region labeled “neurofilament observation region” for all 3 groups.
