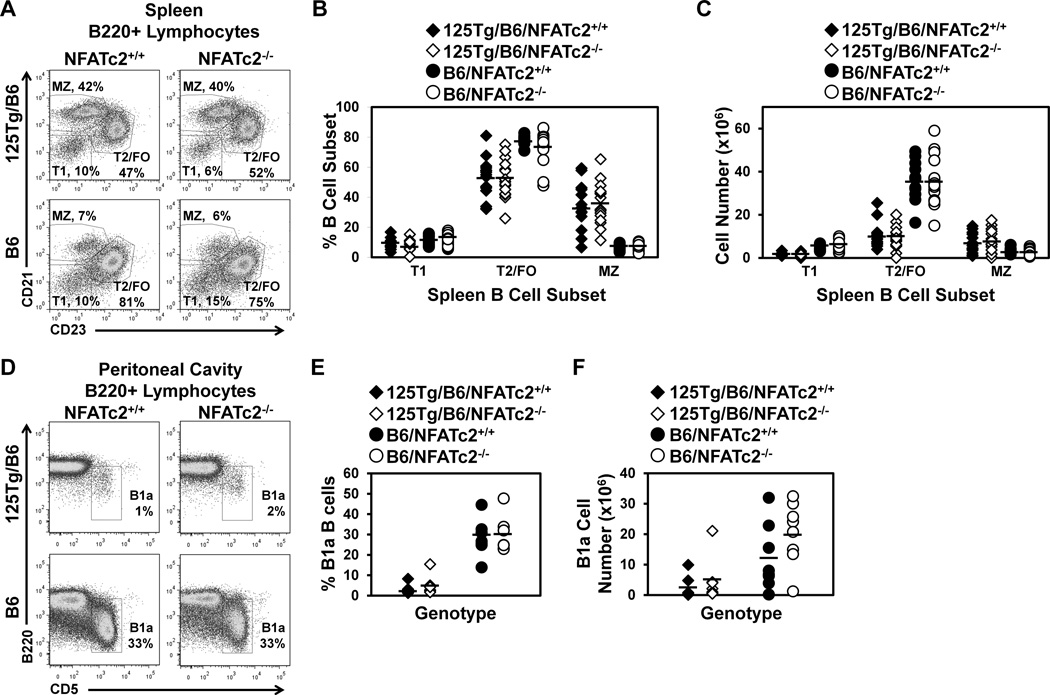
Figure 2. Subsets of peripheral B cells are not affected by NFATc2 deficiency.
(A–C) Freshly isolated splenocytes were harvested and flow cytometry was used to identify B220+ lymphocytes. (A) Representative dot plots indicate the frequency of each B cell subset. CD21 and CD23 expression define T1 (CD21low CD23low), T2/FO (CD21low CD23high), and MZ (CD21high CD23low) B cells in 125Tg/B6 (top) or B6 (bottom) NFATc2+/+ (left) or NFATc2−/− (right) lymphocyte gated splenocytes. (B–C) Summary of percentages (B) or numbers (C) of B cell subsets identified as in (A) of n ≥ 14 mice of each genotype; 125Tg/B6/NFATc2+/+ (black diamonds), 125Tg/B6/NFATc2−/− (white diamonds), B6/NFATc2+/+ (black circles), B6/NFATc2−/− (white circles). (D–F) The frequency of B1a B cells (B220low CD5+) in peritoneal cavity lavage was assessed using flow cytometry. (D) Representative dot plots are gated on B220+ lymphocytes. (E–F) Summary of the percentage (E) or number (F) of B1a cells in n ≥ 7 mice of each genotype; 125Tg/B6/NFATc2+/+ (black diamonds), 125Tg/B6/NFATc2−/− (white diamonds), B6/NFATc2+/+ (black circles), B6/NFATc2−/− (white circles). A two-tailed t-test showed no significant differences conferred by inactivation of NFATc2 in any of the subsets examined.

