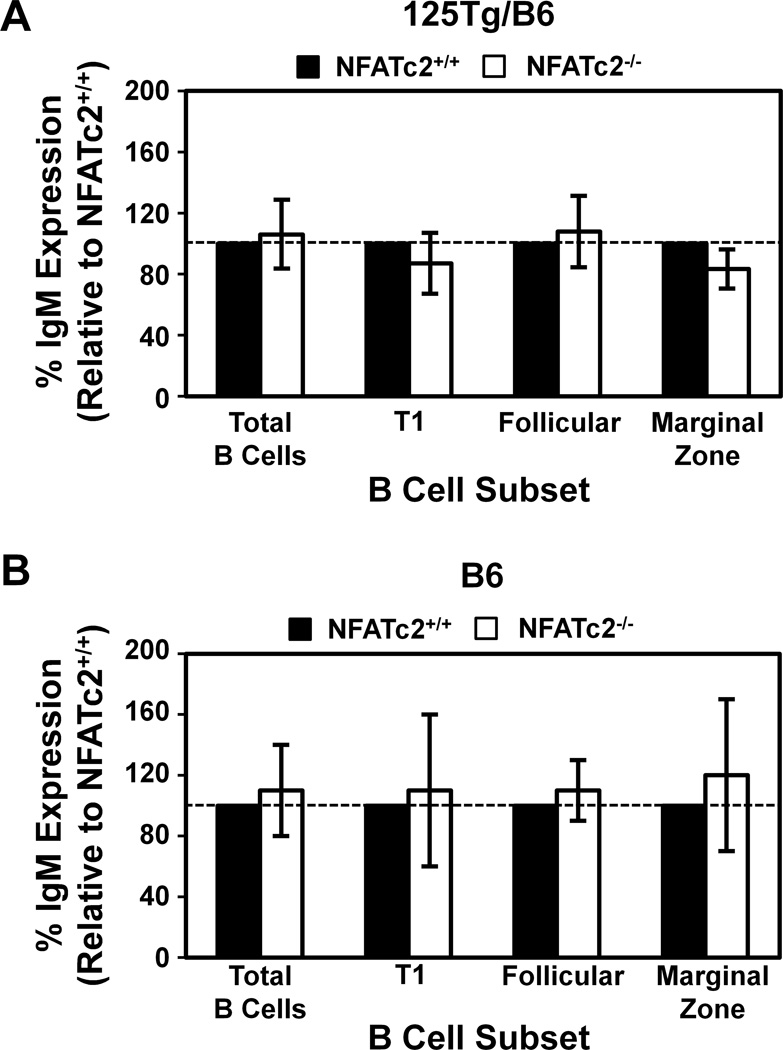
Figure 3. B cell receptor surface expression is not altered by loss of NFATc2.
Freshly isolated splenocytes were harvested and flow cytometry was used to identify B220+ lymphocytes. T1, T2/FO, and MZ B cell subsets were identified as in Fig. 2. The IgM MFI of NFATc2−/− B cells was divided by the IgM MFI of NFATc2+/+ B cells within each subset indicated (white bars), such that NFATc2+/+ IgM relative expression was set to 100% (black bars, shown as reference). The % IgM expression average ± standard deviation is shown for 125Tg/B6 (A) or B6 (B) NFATc2−/− mice; n ≥ 6 mice for each genotype. Dashed line indicates 100% (i.e. no change). A one sample, two-tailed t-test showed no statistically significant differences between the indicated B cell subsets of NFATc2−/− mice relative to 100% IgM expression of NFATc2+/+ mice.

