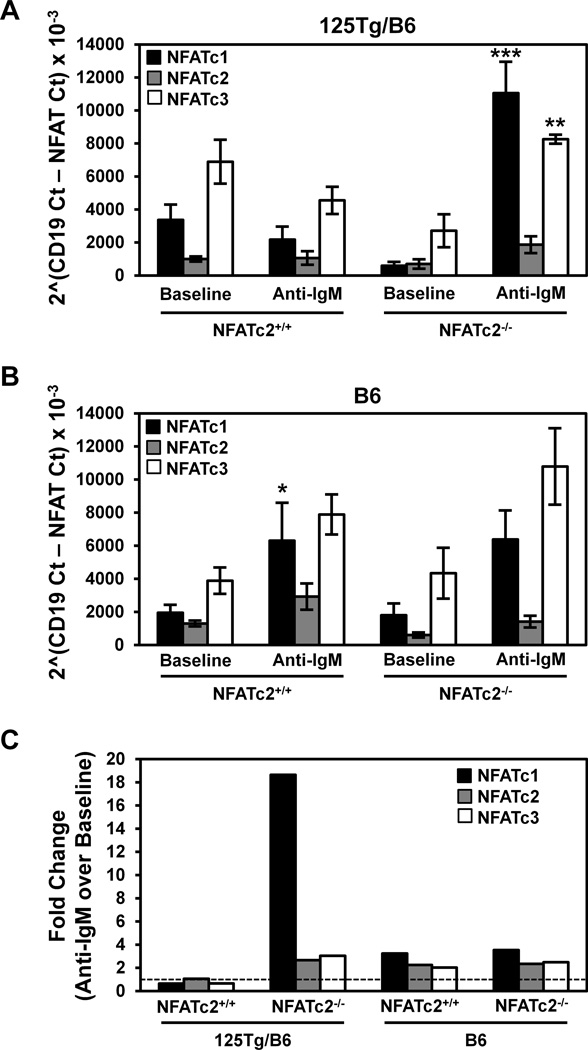
Figure 6. BCR-stimulated NFATc1 and NFATc3 expression is increased when functional NFATc2 expression is lost.
B cells were purified (see Methods) from 125Tg/B6 or B6 NFATc2+/+ or NFATc2−/− mice and were stimulated for 1h at 37°C with or without 10 µg/mL anti-IgM F(ab’)2. Real-time PCR was used to assess the levels of NFATc1, NFATc2, and NFATc3 transcripts at baseline or following stimulation with anti- IgM F(ab’)2. NFAT Ct values were normalized to CD19 transcript levels [2^(CD19 Ct- NFAT Ct)]. Average ± SEM is shown for (A) 125Tg/B6 or (B) B6 mice, n = 3–9 mice in each genotype, n = 3 experiments; * p < 0.05, ** p < 0.01, *** p < 0.001, as calculated by Wilcoxon rank-sum test comparison of anti-IgM stimulation with baseline data for a given NFAT species within each genotype. (C) The fold change of anti-IgM over baseline data in A–B was calculated for each NFAT species within each genotype. The dashed line indicates no change.

