
Table 4.
Numbers of articles (%) according to the sample allocation methods
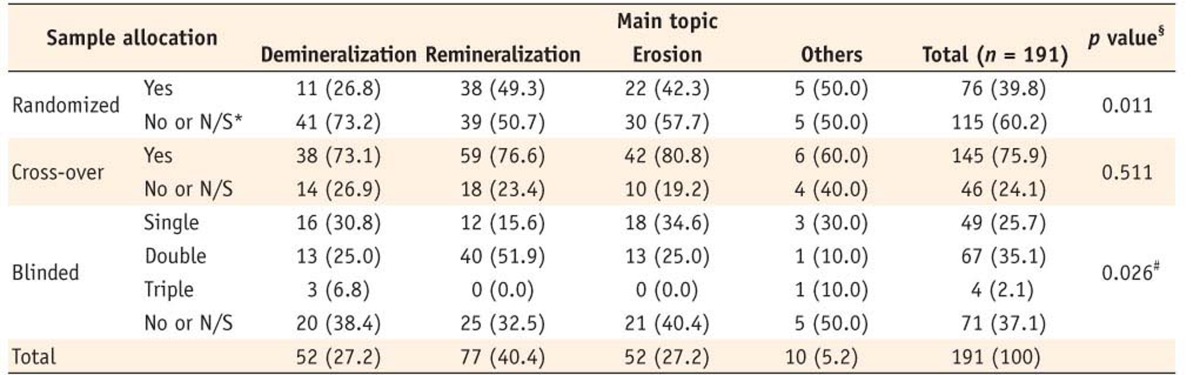
*Not specified.
§p values by the Pearson's chi-square test.
#Frequencies in column of 'Double' and 'Triple' were collapsed in statistical analysis to reduce cells with small expected numbers.