
Fig. 3.
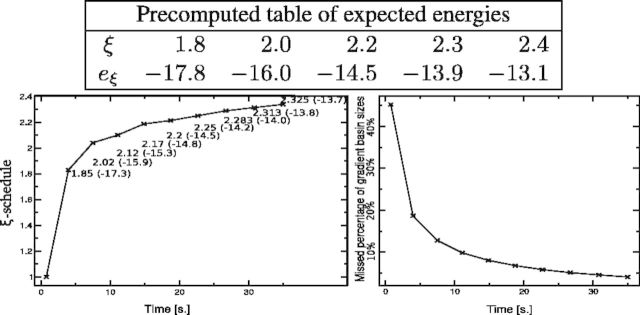
Computation of LMs for Melitaea cinxia U6 snRNA JX878560.1 (107 nt) with RNAlocmin. (Left) Adaptive ξ schedule as a function of run time. For each sampling epoch we show the values of e and ξ as  . The precomputed
  table is shown at the top. (Right) Size-weighted fraction of undiscovered LMs compared with exhaustive enumeration with RNAsubopt and barriers. Basin sizes are estimated from the 106 structures with the lowest energies