
FIG. 2.
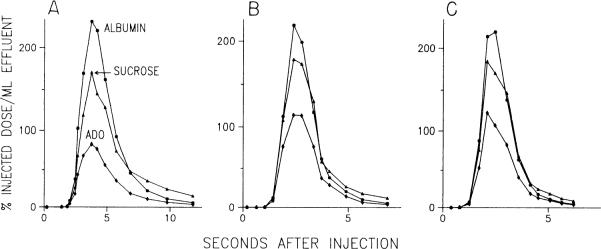
Representative indicator dilution curves before (A), early (B; 3 min), and late (C; min) during norepinephrine (NE) infusion. During both NE curves, tracer appearance is more rapid, and extractions of sucrose and adenosine are lower due to higher flow. PS products calculated from these curves appear in Table 1. ADO, adenosine.