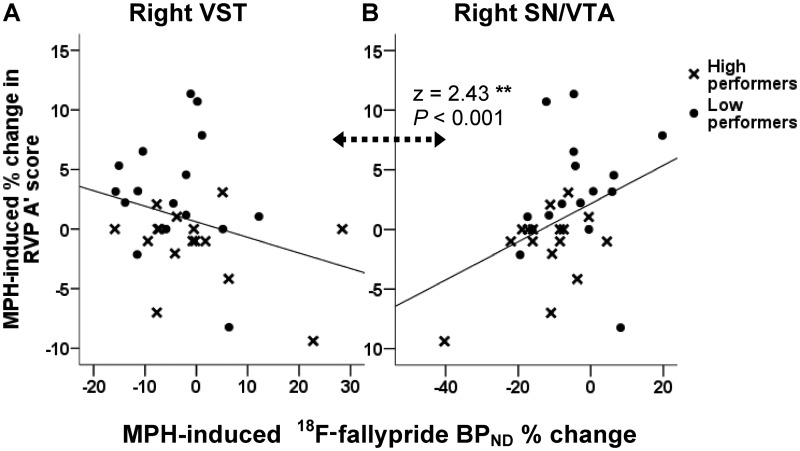
Figure 8.
Regression lines representing the relationship between methylphenidate (MPH) effects on RVP A’ scores and 18F-fallypride BPND % change in (A) right ventral striatum (VST) and (B) right substantia nigra/ventral tegmental area (SN/VTA). Correlation coefficients in these regions were significantly different (z = 2.43, P < 0.001). Note the x-axis scales are different.

