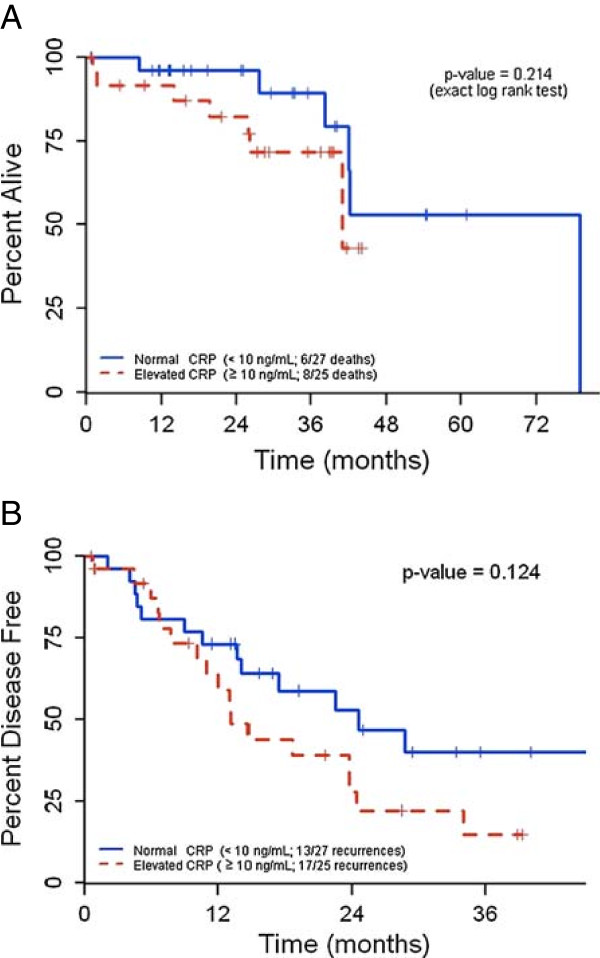
Figure 1.

Kaplan-Meier curves depicting survival as a function of CRP levels. A. Overall survival as a function of serum CRP levels. B. Disease-free survival as a function of serum CRP levels. Groups with elevated and normal CRP levels were compared by log rank test.
