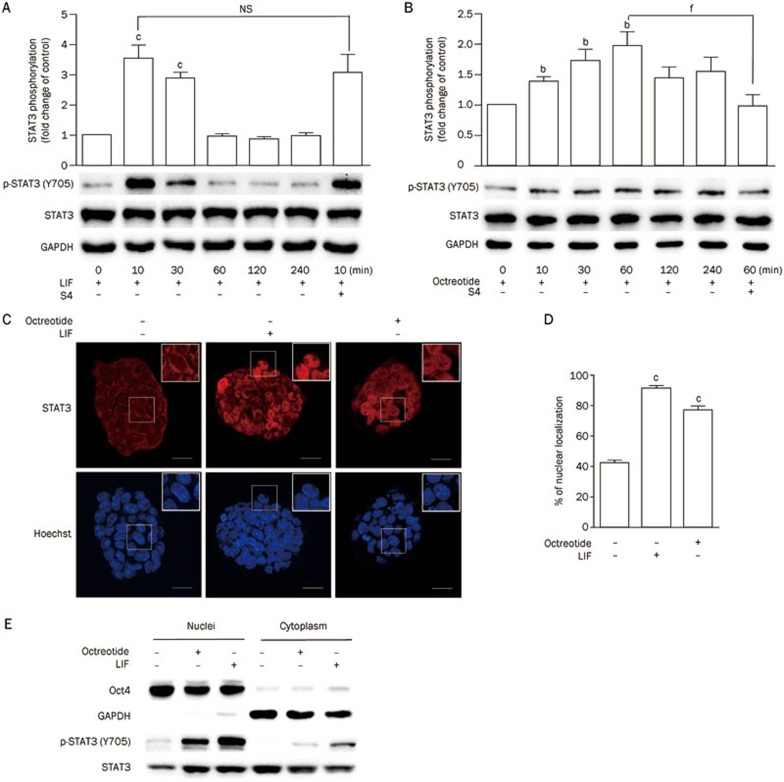
Figure 4.
Activation of SSTR2 induces phosphorylation of STAT3. (A, B) Representative Western blot and statistical analyses of STAT3 phosphorylation in E14 cells stimulated with LIF (1000 U/mL) (A) or octreotide (1 μmol/L) (B) for various durations. The effect of S4 (1 μmol/L) on LIF- or octreotide-induced phosphorylation was also tested. The data are the mean±SEM (n=3). bP<0.05, cP<0.01 vs control. fP<0.01 vs cells treated with LIF or octreotide. (C) Representative confocal images of immunofluorescent staining of STAT3 in E14 cells stimulated with LIF (1000 U/mL, 10 min) or octreotide (1 μmol/L, 1 h) (Scale bar: 10 μm). (D) Statistical analysis of the percent nuclear localization of STAT3 presented in (C). The data are the mean±SEM (n=10 cells). cP<0.01 vs LIF(−) control. (E) Western blot analysis of STAT3 phosphorylation in the nuclei and cytoplasm of mESCs stimulated with LIF (1000 U/mL, 10 min) or octreotide (1 μmol/L, 1 h). Oct4 was used as a nuclear marker, and GAPDH was used as a cytoplasmic marker.

