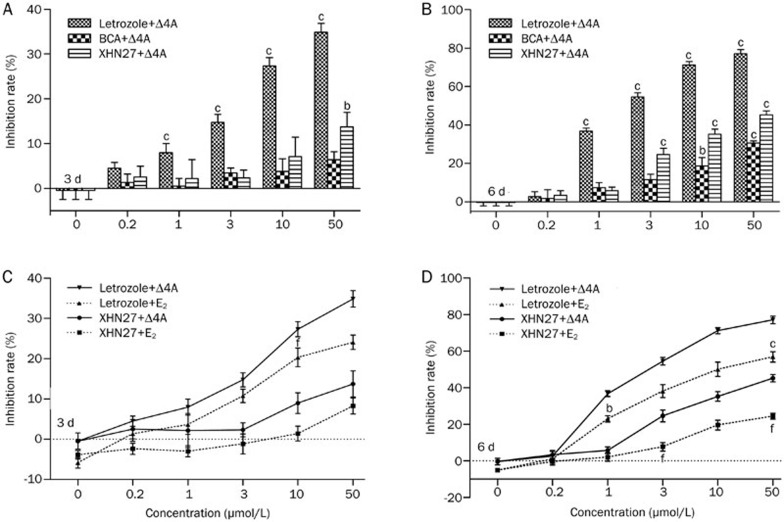
Figure 6.
Effects of letrozole, BCA, and XHN27 on the proliferation of T47D cell cultured with 10 nmol/L Δ4A (A, B) or 1 nmol/L E2 (C, D). Cells were cultured with different concentrations of each compound (0.2–50 μmol/L) for 3 d (A, C) or 6 d (B, D). Values are represented as mean±SEM of three independent experiments (n=3). Significant differences between the compounds-treated groups versus negative control are denoted by bP<0.05, cP<0.01. One-way ANOVA followed by Dunnett multiple comparison post-test. Significant differences between the E2-treated cells (dashed lines) versus Δ4A-treated cells (solid lines) after administration with XHN27 are denoted by bP<0.05, cP<0.01. Significant differences between the E2-treated cells versus Δ4A-treated cells after administration with letrozole are denoted by eP<0.05, fP<0.01.

