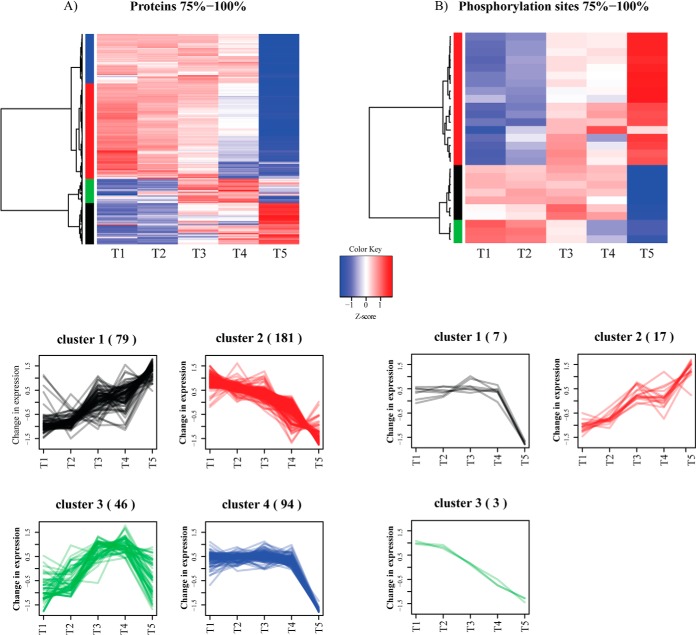
Fig. 3.
Hierarchical clustering analysis of SILAC ratios with highest fluctuation. A, Protein groups; and B, Phosphorylation sites. Fluctuation is defined based on standard deviation, as described in the text. This data concerns biological replicate 1. Data for second biological replicate are presented in supplemental Fig. S12.

