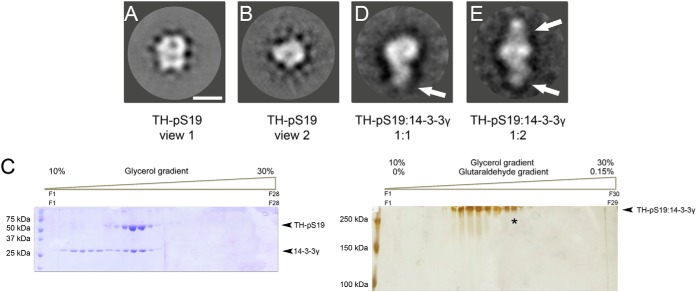
Fig. 4.
Electron microscopy analysis of TH-pS19 and the TH-pS19:14-3-3 complexes. A, two-dimensional average image of TH-pS19 representing the largest population of particles. Bar at bottom right = 100 Å. B, two-dimensional average image of a minority population of particles of TH-pS19. C, glycerol gradients in the absence (left) or presence (right) of cross-linker. The asterisk points to the fraction used for the EM analysis of the TH-pS19:14-3-3 complexes. D, two-dimensional average image of the largest population of TH-pS19:14-3-3 complexes, with one 14-3-3 dimer (signaled by the white arrow) bound to the TH-pS19. E, two-dimensional average image of the minority population of TH-pS19:14-3-3 complexes, with presumably two 14-3-3 dimers bound on opposite sides of TH-pS19.

