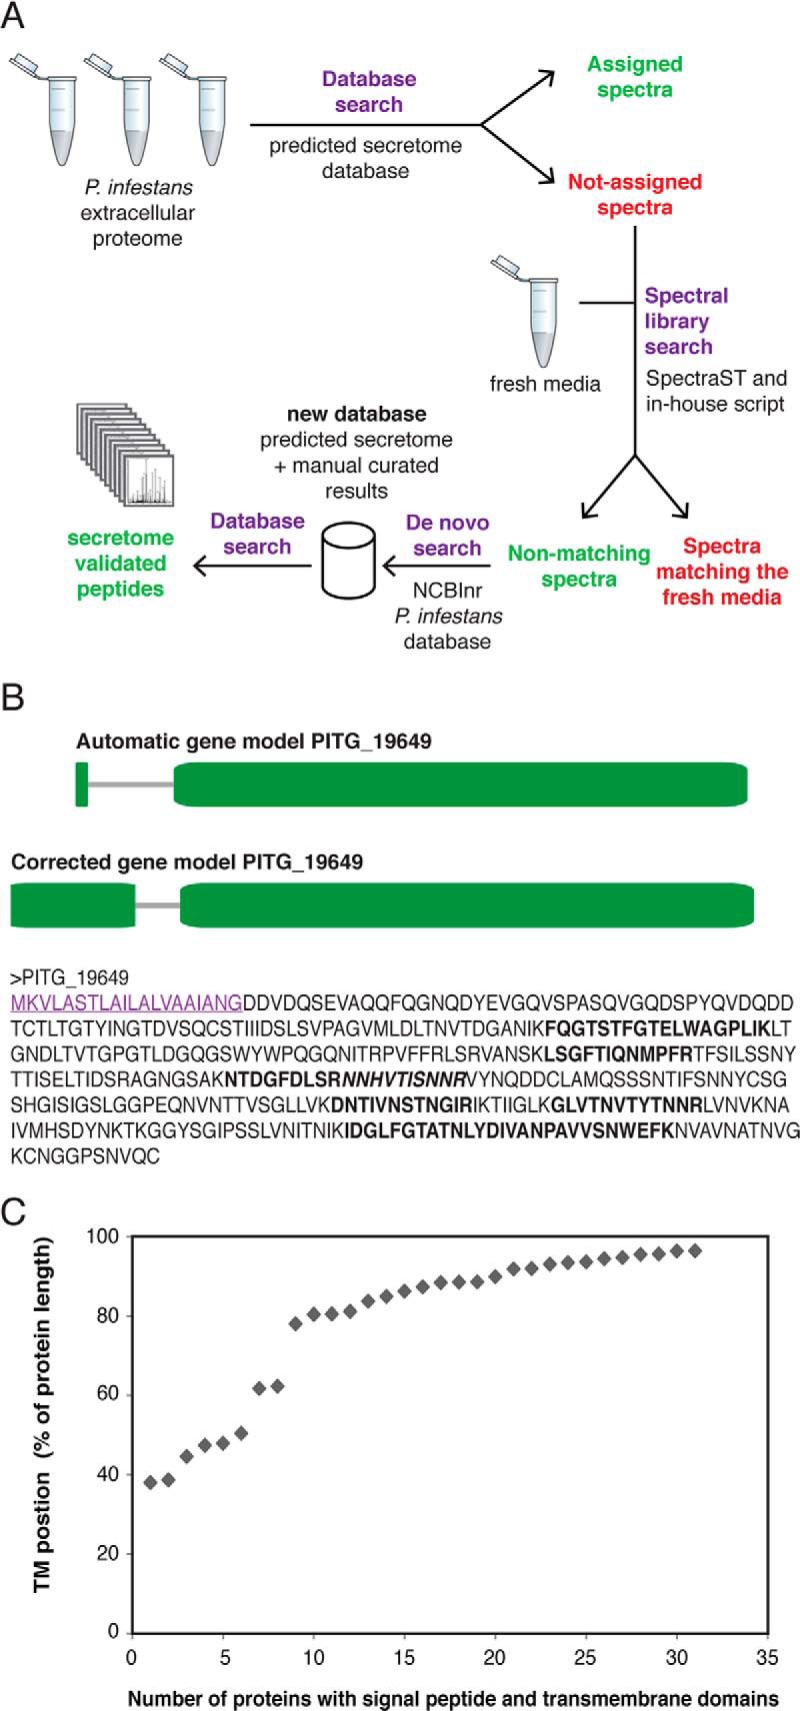
Fig. 2.

A, General mass spectrometric and data analysis workflow used in this study. B, Manual annotation of gene model PITG_19649 encoding an endopolygalacturonase. Top: automatic gene model (www.broadinstitute.org), numbers indicate protein length in AA; Middle: corrected gene model; Bottom: final protein prediction in AA. Signal peptide (SignalPv3.0: 1.000; SignalPv4.0: 0.862) is underlined. All amino acids retrieved in peptides by mass spec analysis are indicated in bold and adjacent peptides are differentiated by (non-)italics. C, Proteins identified from the workflow shown in A, were analyzed for the presence of a signal peptide (SignalP; version 3) and a single transmembrane domain (TMHMM). The transmembrane (TM) location is plotted as relative distance from the protein start for all 31 identified proteins.
