
Fig. 2.
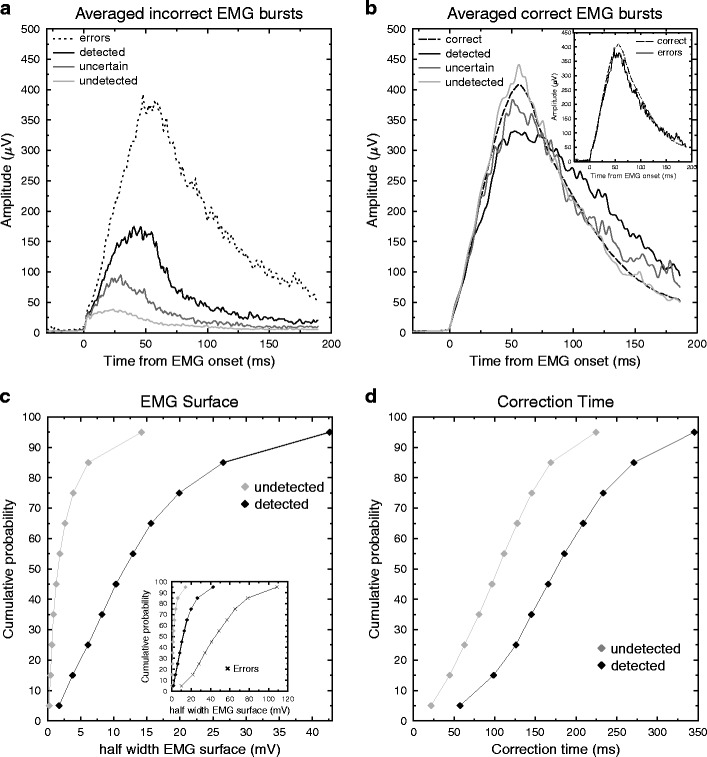
a Grand average of the incorrect EMG bursts: The EMG bursts corresponding to partial errors or overt errors were averaged, time-locked to their onsets, for the three detection categories. b Grand average of the correct EMG bursts observed on partial-error trials for the three detection categories, and for pure-correct trials. For the sake of visibility, the averaged EMG bursts have been smoothed, but all analyses were performed on the raw, unfiltered signals. (Inset: Grand average of pure-correct and error trials.) c Mean cumulative density functions of partial-error surfaces (IncSurf ) for undetected (gray diamonds) and detected (black diamonds) partial errors. Although the lowest values of the two distributions are pretty similar, they quickly diverge. (Inset: For the sake of comparison, this graph also shows the cumulative density function of surfaces for overt errors [black crosses].) d Mean cumulative density functions of CTs for undetected (gray diamonds) and detected (black diamonds) partial errors. The two distribution shapes are more similar than for those for surfaces, showing a more constant shift.