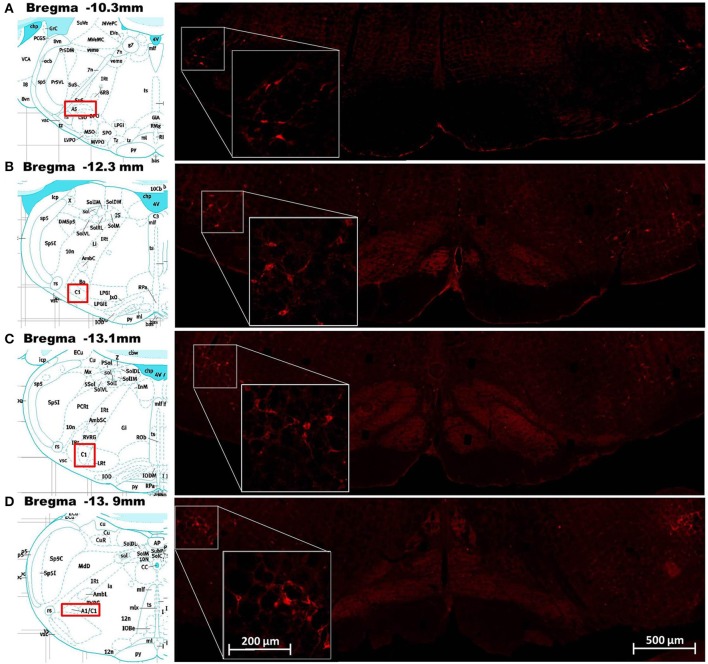
Figure 1.
Demonstration of leptin receptor (ObRb) positive cells at various points along the rostrocaudal axis of the ventral hindbrain. Images in the right column show corresponding histological staining for ObRb (red labeled cells) in the ventral hindbrain at the level of the A5 cell group (A), RVLM (B), C1 cell group (C), and A1 cell group (D). Insets on the right column show histological staining of ObRb at higher magnification in order to show cellular detail. The A5, RVLM, and C1/A1 cell groups described by Paxinos and Watson (2007) are represented in the pictographs, reprinted with permission, in the left column. Scale bars = 200 microns (insets) and 500 microns.

