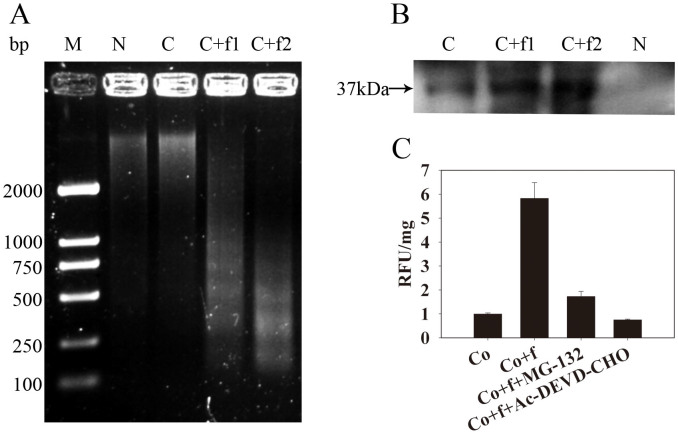
Figure 1. Induction of Cyt f PCD hallmarks in a cell-free system.
(a) DNA laddering and (b) endonuclease activity in the nuclear extracts, which were induced by different concentrations of Cyt f. M, marker; N, isolated nucleus; C, cell-free system including nucleus and cytosolic fraction; C + f1, cell-free system plus 0.2 μM Cyt f; C + f2, cell-free system plus 1 μM Cyt f. Arrowhead points to a 37 kDa dark bands, which reflected the absence of denatured salmon sperm DNA due to DNase activity. (c) Caspase-3-like activity in cytosolic fraction. Co, cell-free system without treatment. Co + f, cell-free system plus 1 μM Cyt f. Co + f + MG-132, cell-free system plush 1 μM Cyt f and 10 μM MG-132. Co + f + Ac-DEVD-CHO, cell-free system plus 1 μM Cyt f and 100 μM Ac-DEVD-CHO. RFU/mg, Relative fluorescence units per mg protein.

