
Figure 5. Viability of mesophyll protoplasts under the expression of Cyt f by FDA staining.
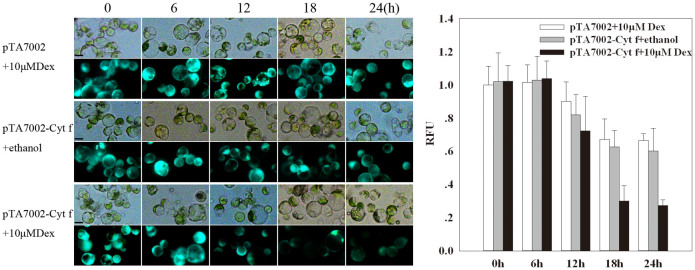
(a) Representative images illustrating protoplasts viability following different treatments at 0, 6, 12, 18, and 24 h, as estimated by FDA staining under bright (upper panel) and fluorescence field (lower panel) for the control (pTA7002 + 10 μM Dex and pTA7002-Cyt f + 10 μM ethanol) and experimental groups (pTA7002-Cyt f + 10 μM Dex). Scale bar = 20 μm. (b) Count of dead cells in (a). Fluorescence intensity was analyzed with Image-Pro Plus, 200 protoplasts for each time point of each treatment were counted and analyzed to indicate the Relative Fluorescence units (RFU). Counting was repeated three times.