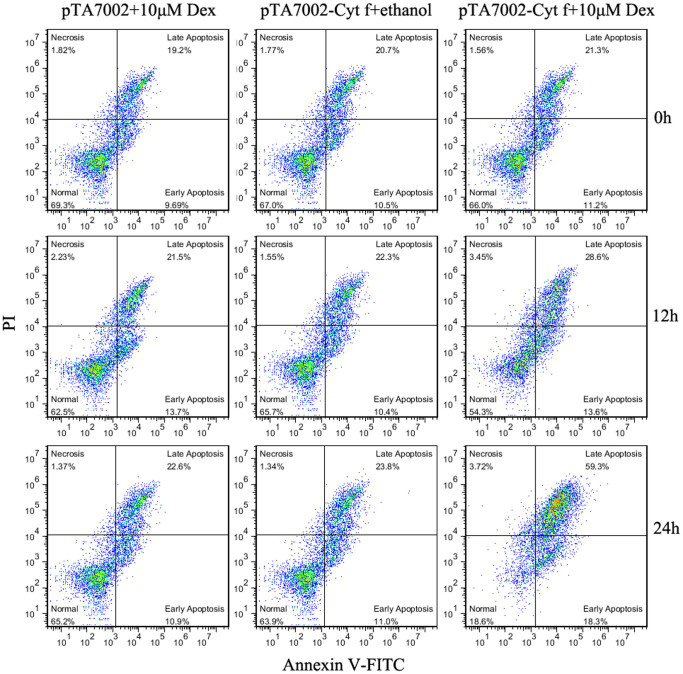
Figure 6. Quantification analysis of PCD mesophyll protoplasts under the expression of Cyt f by flow cytometry.
Representative cytograms illustrating protoplast viability following different treatments at 0, 12, and 24 h, as estimated by annexin V-FITC and PI staining. Late apoptotic-like protoplasts (annexin V+/PI+) are positioned in the upper right quadrant; Early apoptotic-like protoplasts (annexin V+/PI−) are positioned in the lower right quadrant; Normal protoplasts (annexin V−/PI−) are present in the lower left quadrants; Necrotic protoplasts (annexin V−/PI+) are present in the upper left quadrants. To depress the background fluorescence, all the protoplasts for transient expression were prepared from etiolated seedlings.

