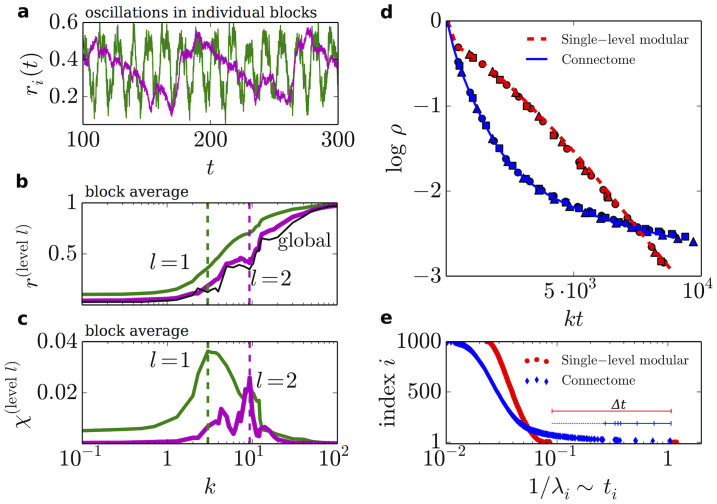
Figure 3. Local synchronization in the human connectome.
(a) Oscillations of the local order parameters (“chimera-like states”) in one particular modulus in the partitions of the HC into 12 (green, l = 1, and k = 3) and 2 (magenta, l = 2, and k = 10) moduli, respectively. The characteristic frequency of these oscillations is typically between 0.01 and 0.1 Hz (a range which coincides with slow modes detected in brain activity; see e.g.32). (b) Average of the local order parameter over all moduli and (c) chimera index for moduli at levels as in a), as a function of k. Global order (thin black line in b)) emerges only after local order is attained at lower levels. (d) Average decay of activity ρ for identical frequencies ω = 0 in the HC network and comparison with a single-level modular network (made up of 4 similar random moduli at a single hierarchical level) of the same size and average connectivity as the HC network. Symbols stand for different values of k. (e) Characteristic decay times corresponding to the inverse of the first 1000 non-trivial eigenvalues of the Laplacian matrix (x axis) as a function of their respective ordered indices (y axis), for networks as in (d). The stretched exponential behavior in (d) is the result of the convolution of slow time scales associated with small eigenvalues in (e).

