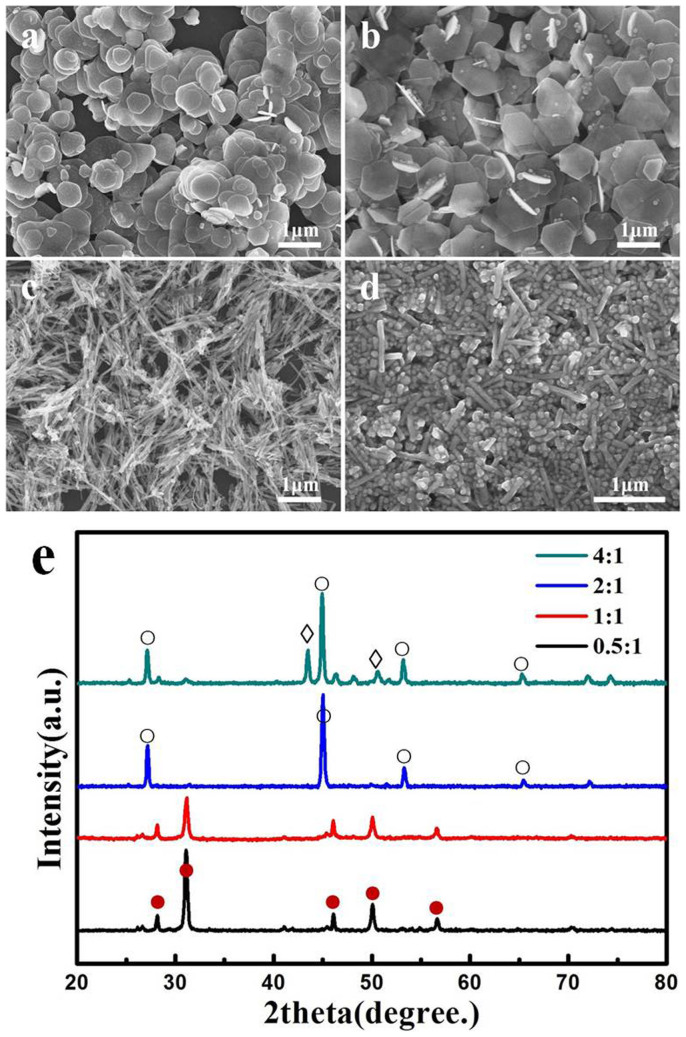
Figure 4.
(a–d) FE-SEM images and (e) XRD patterns of the products prepared with the different molar ratios of Cu2+ to SeO2: (a) 0.5:1, (b) 1:1, (c) 2:1 and (d) 4:1. The diffraction peaks are marked by: (•) klockmannite hexagonal CuSe, JCPDS No. 34-0171; (○) berzelianite cubic Cu2Se, JCPDS No. 88-2044 and (◊) cubic Cu, JCPDS No. 03-1018.

