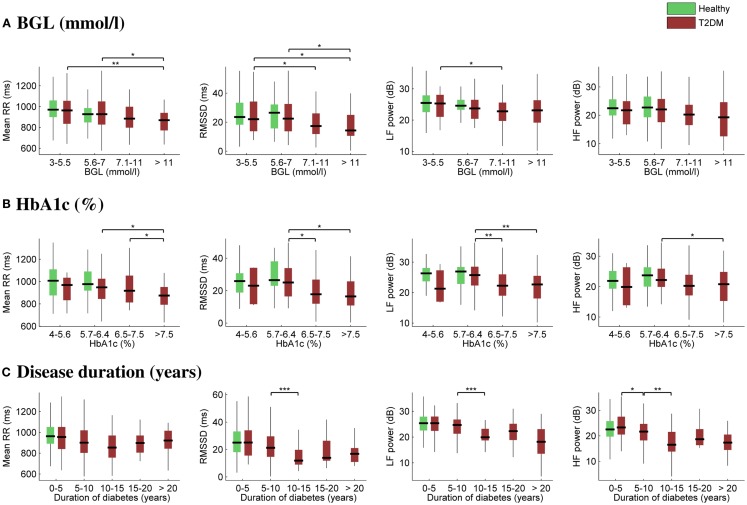
Figure 2.
Box plots of selected HRV associations with BGL (A), HbA1c (B), and duration of diabetes (C). On each box, the central mark is the median, the edges of the box are the 25th and 75th percentiles, and the whiskers extend to the most extreme parameter values excluding outliers. Significant differences between all the “boxes” (A,B) or between successive “boxes” (C) were tested using the Mann–Whitney U test (***p ≤ 0.001; **p ≤ 0.01; *p ≤ 0.05).

