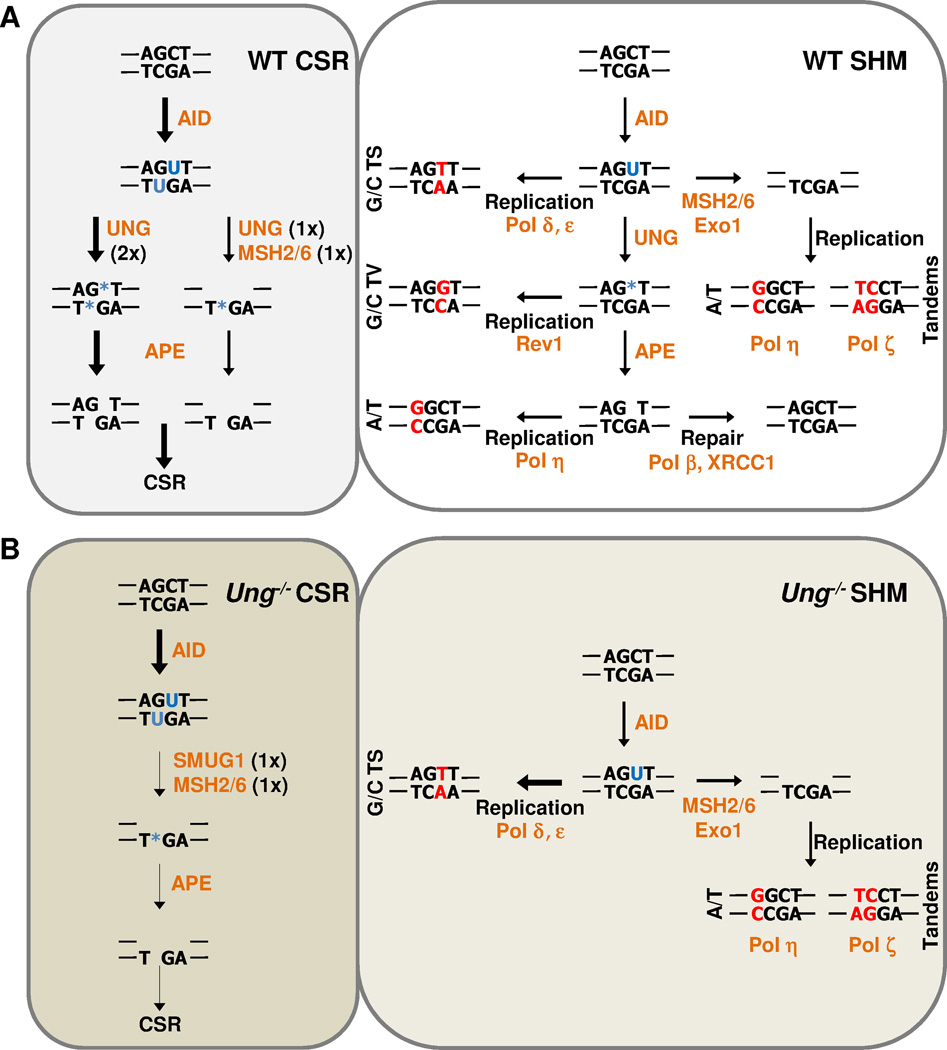
Figure 1. The Neuberger model.
The known mechanisms of uracil processing for CSR (left) and SHM (right) in (A) wild type or (B) Ung−/− mice are depicted. Arrow thickness represents the relative efficiency of the pathway. Blue nucleotides represent DNA lesion, (U – uracil, * - abasic site). Red nucleotides represent fixed mutations. Orange represents enzymes. 1×, creates one nick; 2×, creates two nicks, TS, transition; TV, transversion.

