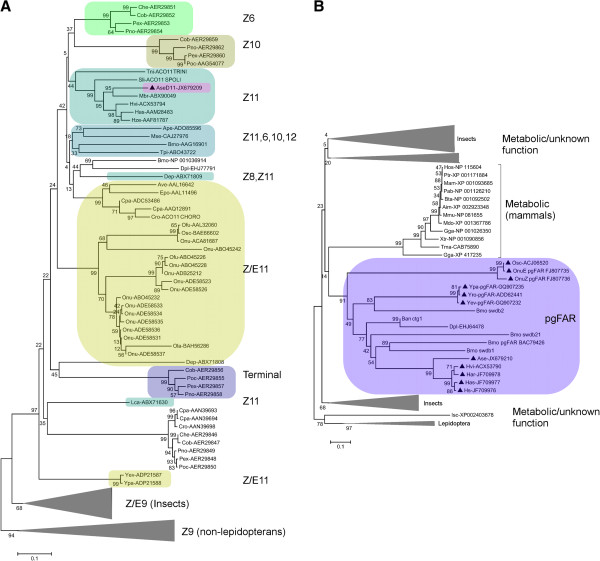
Figure 2.

Phylogenetic analysis of AseΔ11 and AseFAR. A) Shows a Fatty-Acyl Desaturase (FAD) phylogenetic tree, in which Ase∆11 (pink) clusters with moth ∆11-desaturases in a subgroup of ∆11 noctuid homologs (grey green). B) Shows a Fatty-Acyl Reductase (FAR) phylogenetic tree, where the AseFAR clusters in a well-supported group (purple) of lepidopteran pgFARs (marked with triangles). Species abbreviations can be found in Additional file 5.
