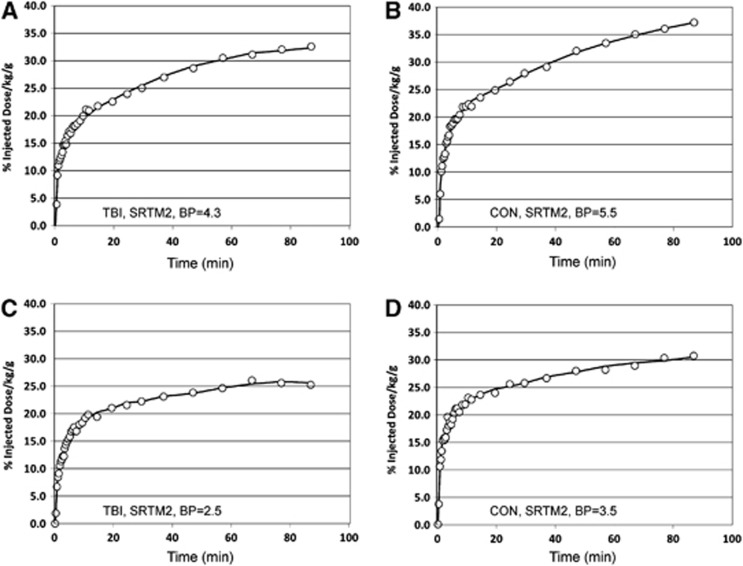
Figure 1.
Putamen [11C]βCFT time activity curves (open circles) that depict the high (top) and low (bottom) ranges of [11C]βCFT binding in TBI (A/C) and control (B/D) subjects. Also shown are the SRMT2 curve fits (solid lines) to the observed PET data and corresponding quantitative binding potential (BP) values. PET, positron emission tomography; TBI, traumatic brain injury.

