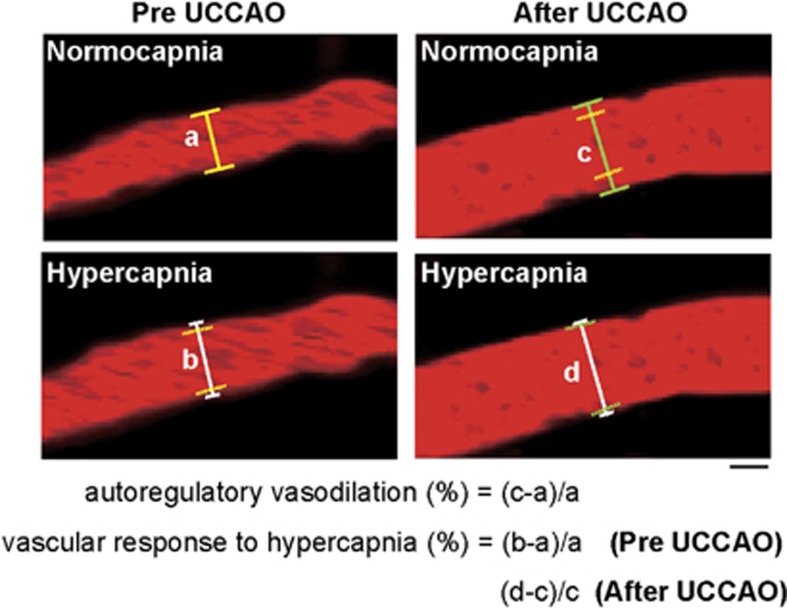
Figure 1.
Two-photon laser scanning microscopy images of a pial arteriole before and after unilateral common carotid artery occlusion (UCCAO) during both normocapnia and hypercapnia taken at the cerebral cortical surface. Scale bar, 10 μm. After UCCAO, red blood cell speed seems to have dramatically decreased. Autoregulatory vasodilation was calculated as the percentage change in diameter from the preoperative value on each experimental day. Vascular response to hypercapnia was calculated as the percentage change in diameter during hypercapnia in reference to normocapnia. Solid lines perpendicular to the vessels indicate the diameter of the arterioles in each condition. Yellow dashed lines indicate the position of the vessel wall during normocapnia before UCCAO (a). Green dashed lines indicate the position of the vessel wall during normocapnia after UCCAO (c). (a–d) Indicate the vessel diameter during normocapnia before UCCAO, during hypercapnia before UCCAO, during normocapnia after UCCAO, and during hypercapnia after UCCAO, respectively.

