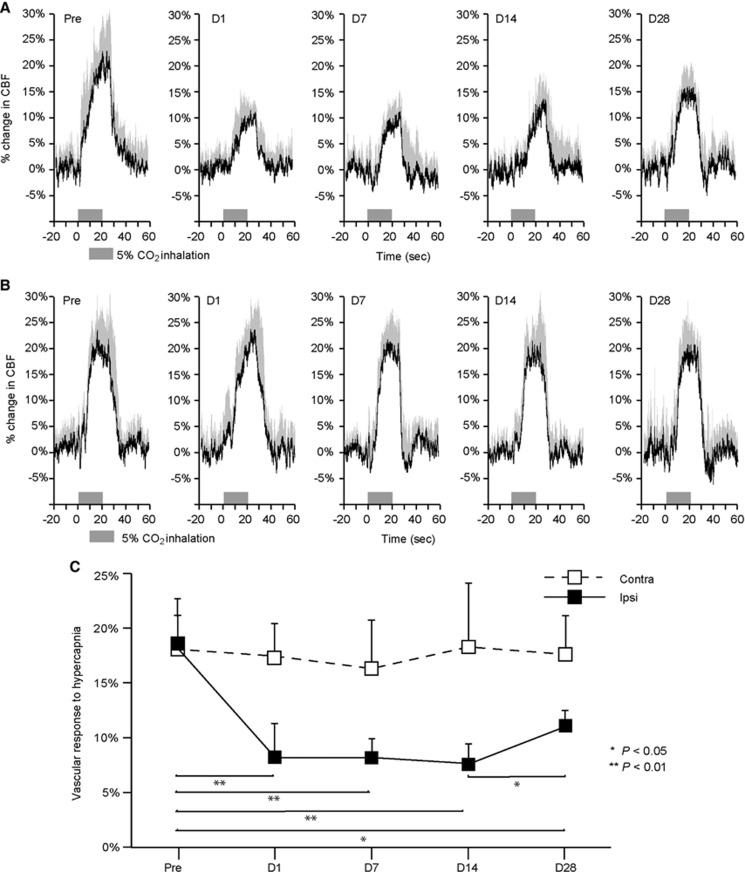
Figure 2.
Vascular responses to hypercapnia during chronic hypoperfusion in the bilateral cerebral hemisphere. (A, B) Time–response curves for the normalized increase in cerebral blood flow (CBF) response to hypercapnia during chronic hypoperfusion in the hemisphere ipsilateral to unilateral common carotid artery occlusion (UCCAO) (A) and in the hemisphere contralateral to UCCAO (B). The horizontal bars indicate the 5% CO2 inhalation period. These data were normalized to the pre-CO2 inhalation level (20 seconds before 5% CO2 inhalation). Each response curve represents the mean for all animals on each measurement day. The error bars indicate standard deviation. (C) Mean percentage increase in CBF in the bilateral hemisphere within 10 to 20 seconds of 5% CO2 inhalation. Ipsilateral hemisphere (Ipsi, black); contralateral hemisphere (Contra, white). The error bars indicate standard deviation. *P<0.05, **P<0.01.

