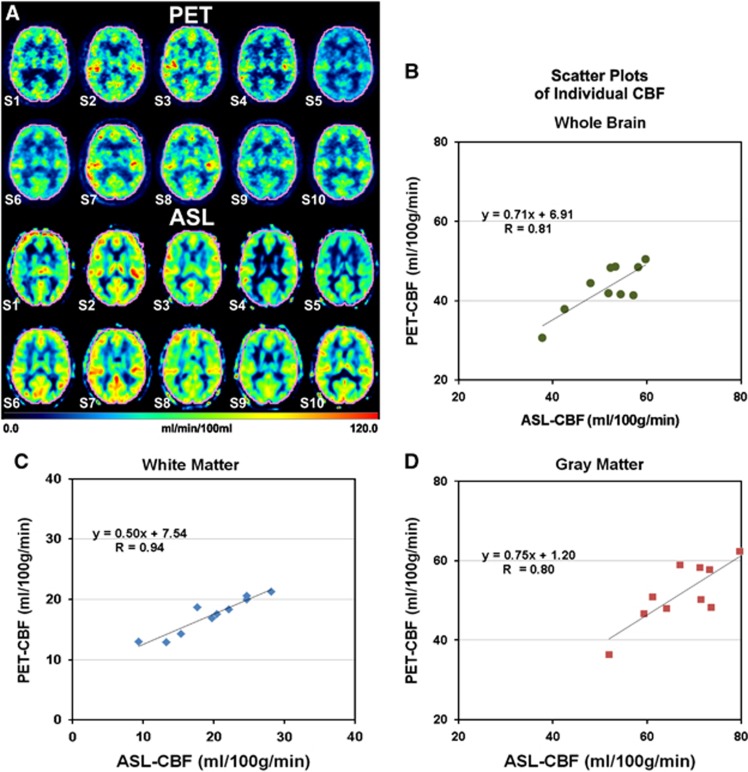
Figure 4.
Comparative images of PET-CBF and ASL-CBF at the level of the basal ganglia in the individual subjects S1 to S10 (A). All images are normalized to the MNI space. A VOI (in pink) comprising the entire brain was defined for the calculation of the whole-brain CBF. Scatter plots of VOI averages of CBF in the whole brain (B), white matter (C), and gray matter (D) indicate positive correlations between PET-CBF and ASL-CBF. R is the Pearson correlation coefficient. ASL, arterial spin labeling; CBF, cerebral blood flow; MNI, Montreal Neurological Institute; PET, positron emission tomography; VOI, volume of interest.

