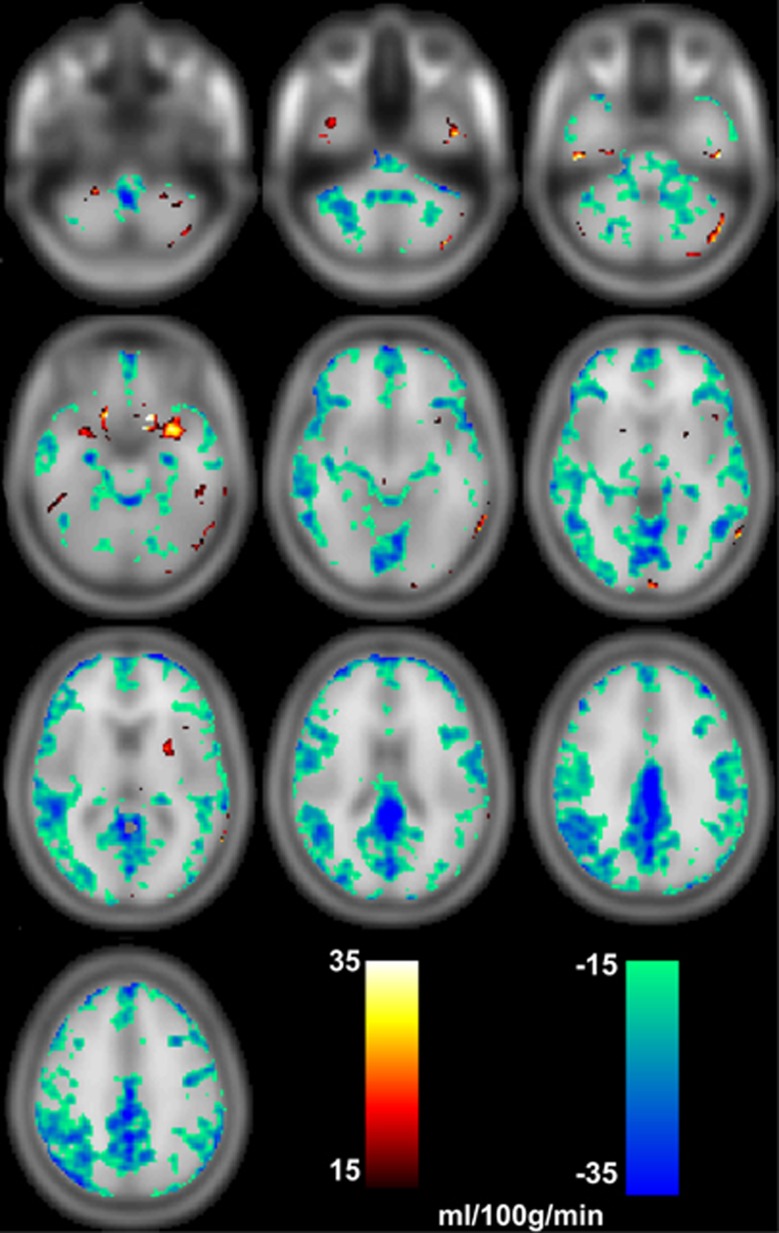
Figure 6.
Images PET-CBF minus ASL-CBF showing differences (P<0.01 uncorr.) in the ranges of 15 to 35 mL per 100 g per minute and −15 to −35 mL per 100 g per minute. Especially in cortical regions CBF measured by ASL is higher than measured by PET. ASL, arterial spin labeling; CBF, cerebral blood flow; PET, positron emission tomography.

